
Why Your Conversion Rate Is Lying to You
- Your Shopify conversion rate is calculated correctly and is almost certainly misleading you.
- The number moves when your traffic mix changes, even if nothing in your store changed at all.
- Running paid ads attracts bot traffic from countries you do not sell to. It inflates your session count and tanks your CVR without a single real customer having a worse experience.
- The version of this metric that actually tells you something is segmented: by source, by device, and by country.
- The funnel breakdown — add-to-cart rate, checkout rate, purchase rate — tells you where buyers are dropping, not just that they are.
Your Shopify conversion rate is not wrong. It is doing exactly what it is supposed to do: counting the percentage of sessions that resulted in a purchase. The problem is that most merchants use it as a measure of how well their store is working, and it is a terrible measure of that.
What Shopify is actually counting
Shopify calculates conversion rate as orders divided by sessions. Sessions include everyone who lands on your store: people who typed your domain directly, people who clicked a cold ad, people who came from a Google search for your brand name, people who landed on the wrong page and left in three seconds, and returning customers who already knew they were buying. They all count as sessions. They all go in the denominator.
When you look at a 2.1% conversion rate, that number is the average outcome across all of those very different visitors, combined into one figure. It tells you what happened. It does not tell you why, or where, or who.
Why your CVR changes when nothing changed
You run a sale and send an email to your list. Your conversion rate spikes. Your store did not suddenly get better. You just sent a pile of warm, high-intent buyers into a denominator that is now weighted toward people who were already planning to purchase.
You launch a cold ad campaign. Your conversion rate drops. Your store did not get worse. You added thousands of sessions from people who had never heard of you, most of whom were not ready to buy on the first visit. Diluting the denominator with cold traffic will drop your aggregate CVR every time, even if the ad is working exactly as it should.
This is the trap. Merchants see the number fall and start looking for what broke. They rewrite copy, change images, move buttons around, run an A/B test on the hero image. None of that is addressing what actually changed, which was the composition of their traffic.
The bot problem nobody warns you about
Running paid ads introduces another variable that most merchants never think to check: invalid traffic. When you launch a Google Ads or Meta campaign, you are not just attracting potential customers. You are also signaling to bot networks, click farms, and scrapers that your store is active and being measured. They follow.
The tell is in your geographic data. Pull your sessions by country and look for spikes from places you do not sell to: China, Russia, Singapore, Thailand, Pakistan, Indonesia. If you are a US-focused store and suddenly 15% of your sessions are coming from Southeast Asia the week after you launched a campaign, that is not organic interest. That is invalid traffic riding in on the back of your ad activity.
This matters for your conversion rate in the most direct way possible: these sessions almost never convert, and they go straight into your denominator. A flood of bot traffic from five countries you do not ship to can cut your reported CVR in half without a single real customer having a worse experience in your store.
If you are not running Cloudflare in front of your store, you are more exposed than you should be. Cloudflare’s free tier blocks a significant volume of known bad traffic before it ever reaches Shopify and registers as a session. It is not a complete solution, but it is the fastest thing you can do to reduce the noise.
Beyond Cloudflare, the cleanup checklist:
- GA4 filters: exclude sessions from countries you do not sell to. Set up a filtered data stream or use the reporting identity settings to exclude known bot traffic.
- Google Ads invalid clicks: check your campaign’s invalid click report. Google filters some automatically, but not all. If you are seeing high impression share from unexpected geographies, tighten your location targeting and set bids to “people in or regularly in” your target locations, not “people interested in.”
- Meta Ads Audience Network: if you are running Meta campaigns with Audience Network placements enabled, disable them. Audience Network is the single largest source of low-quality traffic in most Meta accounts. Turn it off, run for two weeks, check your CVR by placement.
- Shopify analytics vs. GA4: Shopify counts every session including ones GA4 might filter. If your session counts look dramatically different between the two, the gap is often bot traffic that one platform is catching and the other is not. GA4 with filters applied is generally the cleaner number.
The number that actually tells you something
Segmented conversion rate is a different metric. Slice the same sessions by source and you get a reading for each traffic channel independently: your email CVR, your organic CVR, your paid social CVR, your branded search CVR. These numbers move for different reasons and require different responses.
A drop in email CVR means something is wrong with your email audience, your offer, or your landing page for that segment. A drop in paid social CVR might mean your ad is attracting the wrong audience, or your landing experience is not matching the creative. A drop in branded search CVR is worth investigating carefully, because those are high-intent visitors who already know you.
Device segmentation matters too. A store converting at 3.5% on desktop and 0.9% on mobile does not have a conversion rate problem. It has a mobile experience problem. The aggregate number tells you nothing about that gap.
Where the real diagnostic lives: reading the funnel
The aggregate conversion rate tells you a ratio. The funnel tells you where buyers are actually stopping — and each gap between steps points at a completely different problem.
Sessions → Added to cart
This gap is your product page’s report card. A healthy add-to-cart rate for most stores running filtered, human-only traffic sits somewhere between 5% and 10%, though it varies by category and price point. If yours is below that, the page is not doing enough to get someone to commit to even considering the purchase.
What tends to cause a low add-to-cart rate: unclear value proposition, price shock with no justification, images that do not answer the questions a buyer has before touching the product, missing size or fit information, no trust signals near the buy button. The page answered “what is this” but not “why should I want this.”
Added to cart → Reached checkout
People who add to cart have already decided they want the product. The drop here is almost always caused by something that happens at the cart, not a change of mind about the product itself.
The most common culprits: shipping cost appearing for the first time at cart, forced account creation before checkout, a cart page that is slow or broken on mobile, no visible return policy near the proceed button. This is the step where people pause and ask whether they actually trust you enough to hand over a card number — and if the answer is not obviously yes, they leave.
Reached checkout → Completed checkout
People who reach checkout are serious buyers. A high drop rate here is almost always a friction problem, not a consideration problem.
The most common causes: too many form fields, address validation errors on legitimate addresses, a preferred payment method not available (especially PayPal, Shop Pay, or buy now pay later options for higher-priced items), or a confusing multi-page flow. On mobile specifically, auto-fill failures cause more abandonment than most merchants realize.
This is the step where Shopify’s native checkout tends to outperform custom or third-party checkouts — fewer moving parts, more trust signals, better mobile optimization out of the box. If your Reached checkout to Completed checkout rate is low and you are not running Shopify’s default checkout, that is the first thing to investigate.
How to use the funnel in practice
Find your biggest percentage drop and start there. A 100-visitor funnel that shows 8 adding to cart, 6 reaching checkout, and 3 completing is a checkout problem. The same funnel with 3 adding to cart, 3 reaching checkout, and 3 completing is a product page problem. Same final CVR, completely different fix. The aggregate number would tell you nothing. The funnel tells you exactly where to look.
How to build a clean CVR report in Shopify Analytics
Shopify has everything you need for a clean funnel view built in — most merchants just never configure it. Here is the setup:
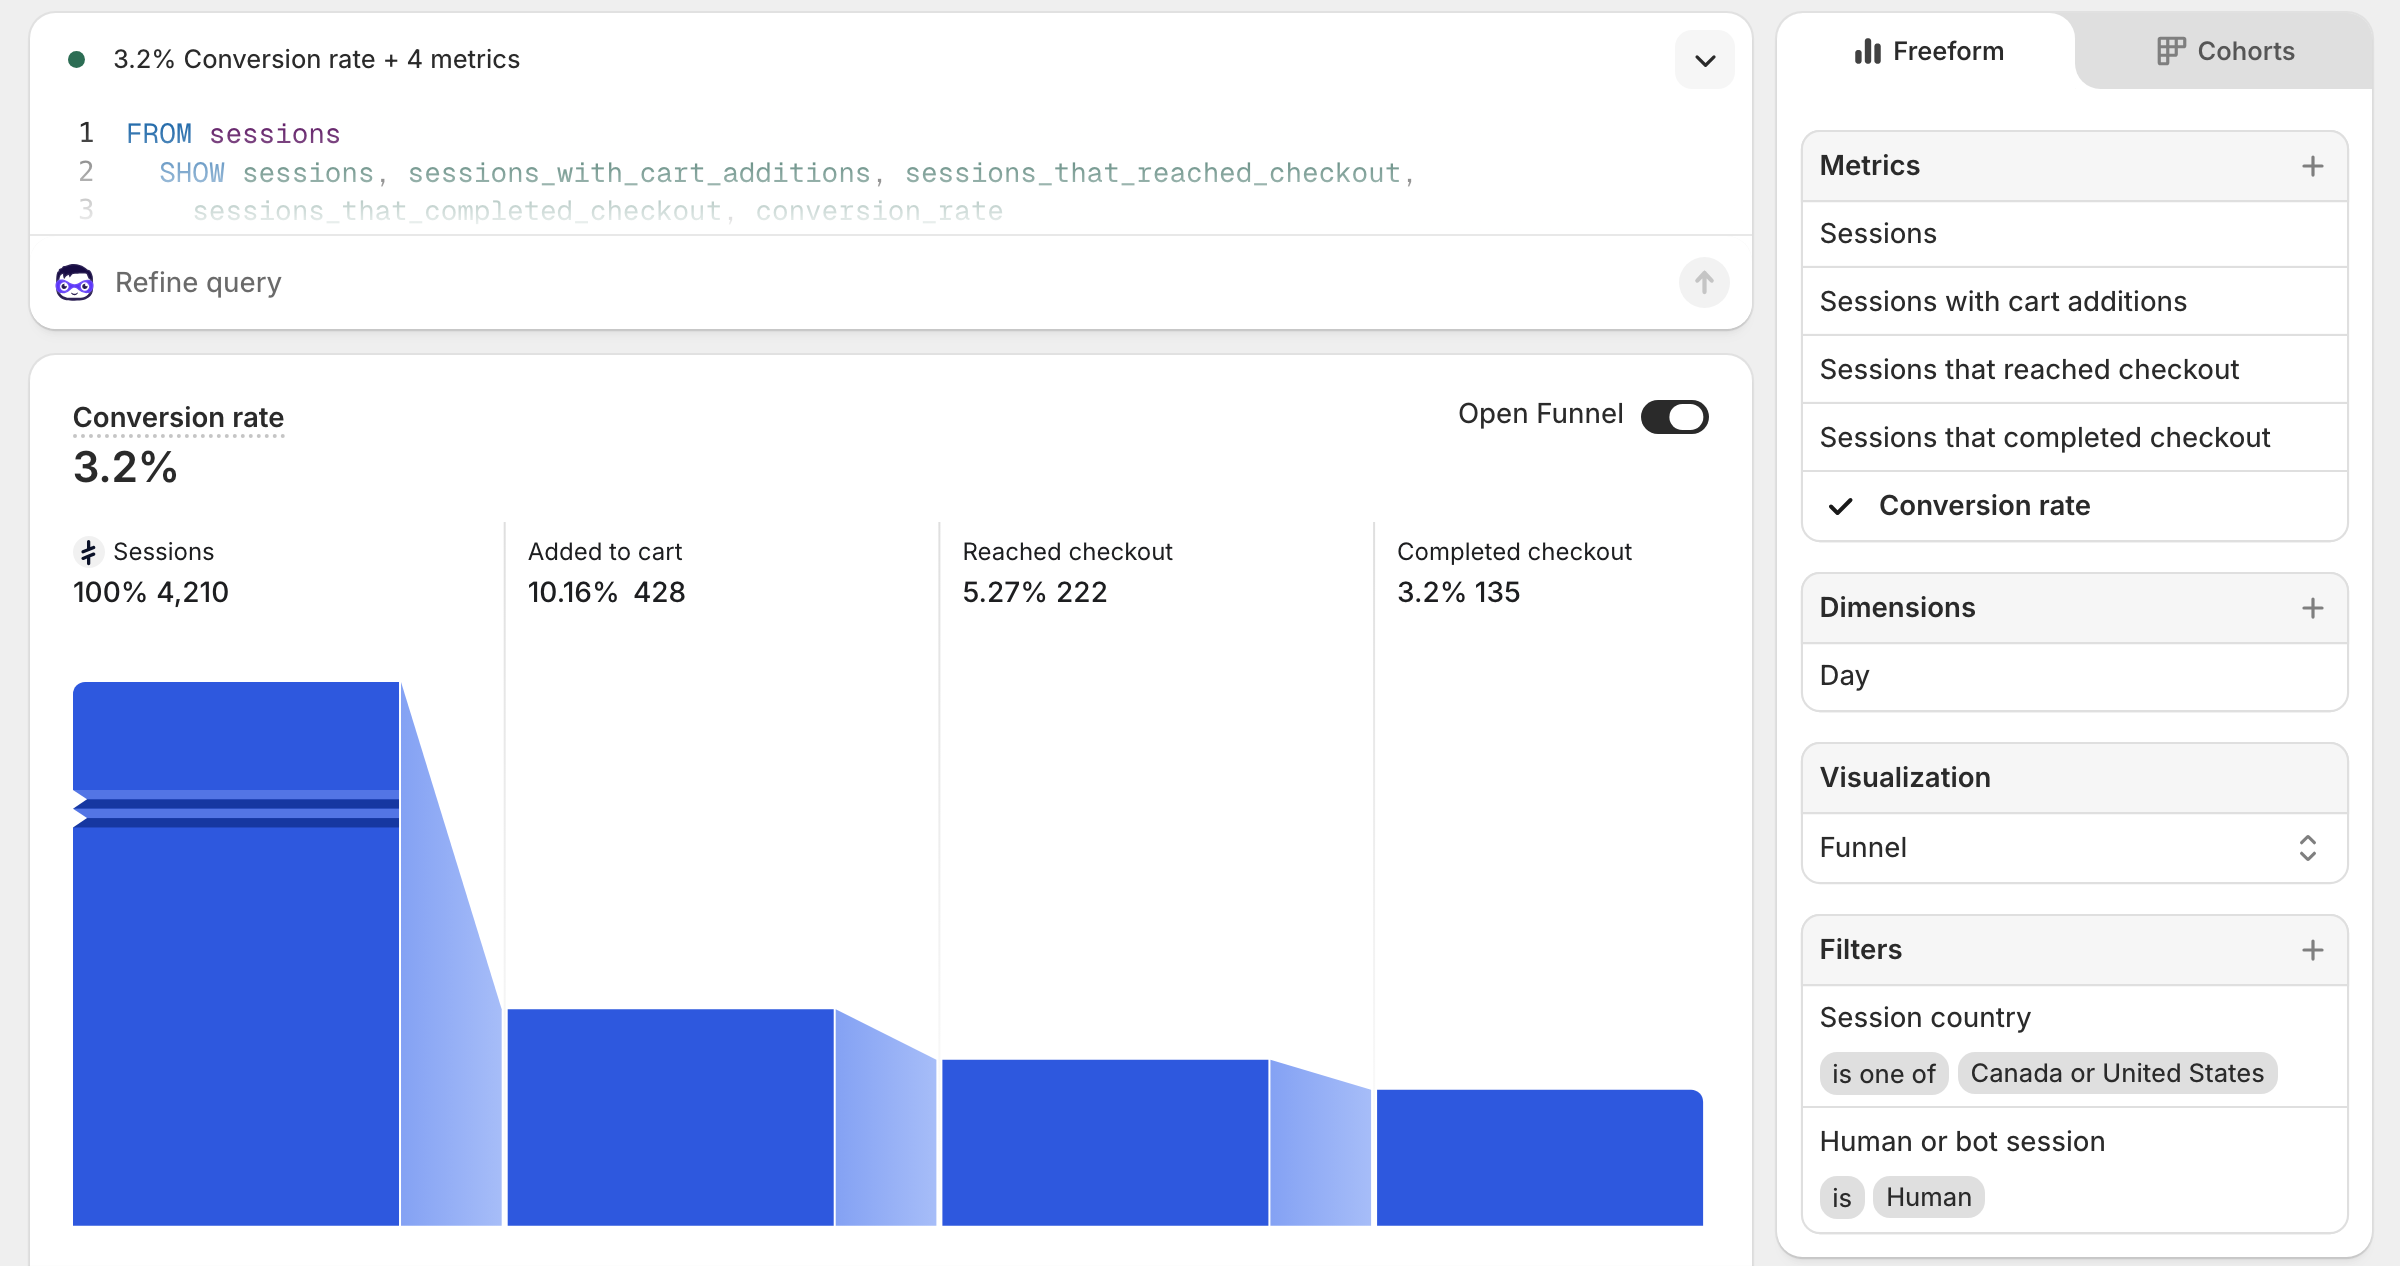
- Go to Analytics > Reports and open the Conversion rate breakdown report.
- Add a filter: Human or bot session = Human. This removes invalid traffic before it touches your numbers. It is the most important filter you can apply.
- Add a filter: Session country = [your markets]. If you sell to the US and Canada, set it to those two. This eliminates the geographic noise from countries you will never ship to.
- Set the visualization to Funnel. You get the full sequence in one view: Sessions, Added to cart, Reached checkout, Completed checkout, and conversion rate — all filtered to real humans in your actual markets.
- Pin it to your dashboard. This is your CVR report now. The number on this report is the one worth tracking week over week.
The funnel view is where the real diagnostic value is. When the drop from Added to cart to Reached checkout is steep, your cart is losing people. When the drop from Reached checkout to Completed checkout is steep, checkout is the problem. Each gap points at a different fix.
If you are running GA4, it is worth setting up equivalent filters there as well — country exclusions and bot filtering follow the same logic. The Shopify report is the faster setup, but having a second clean source to cross-reference is useful when the numbers start telling different stories.
The metrics worth actually tracking
Aggregate CVR goes on the list of numbers you glance at and do not act on. These are the ones worth building a dashboard around:
- CVR by traffic source. Email, organic, paid search, paid social, direct — each segment moves independently and breaks for different reasons.
- CVR by device. Desktop and mobile are different stores from a UX standpoint. A blended number hides which one is dragging.
- Add-to-cart rate. This is your product page’s job. If it is low, the page is not closing the consideration gap.
- Checkout initiation rate. The gap between add-to-cart and checkout start is usually cart abandonment: unexpected shipping cost, required account creation, lack of trust signals.
- Purchase completion rate. The gap between checkout start and purchase is usually a friction problem: too many steps, payment method missing, form errors.
- Sessions by country. Run this weekly if you are running paid ads. Unexplained spikes from countries you do not sell to are almost always invalid traffic, inflating your session count and depressing your CVR at the same time.
Pull these segmented by source and device, set a 90-day window so you have volume, and look at trends rather than snapshots. A conversion rate that is moving is telling you something. A conversion rate that is flat while traffic doubles is also telling you something. The aggregate number tells you neither.